NewRelic
NewRelic integration will create NewRelic metrics for DAG running, success, and failed status.
Setup
Create a new New Relic API Key following their guide.
Note that the type should have INGEST - LICENSE.
Configuration
api_key: (Required) the API Key from abovemetric: (Optional) Override the name of the metric. The default isairflow.priority, which will product metrics likeairflow.priority.p1.failedtags: (Optional) Optional extra tags to include, should be a JSON{"key":"value", e.g.{"tag1":"val1","tag2":"val2"}threshold: (Optional) Maximum alert threshold. Alerts with higher numerical priority (lower logical priority) will be ignored
Example
[priority.newrelic]
api_key = the api key
metric = my.custom.metric  # will produce metrics like my.custom.metric.p2.success
threshold = 2  # only P1 and P2
Monitor
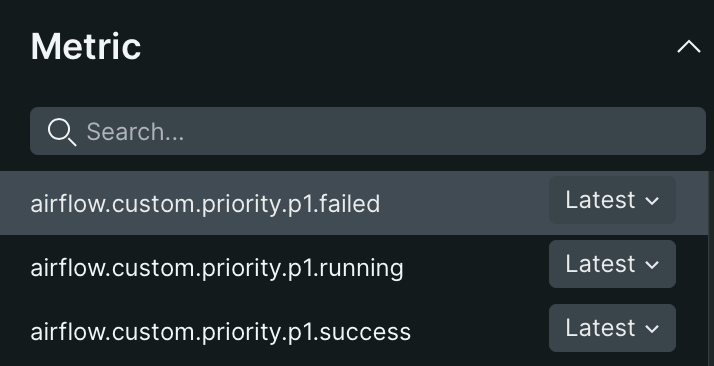
Under Query Your Data in the New Relic UI, you can create a query for the new custom metric:
SELECT latest(`airflow.priority.p1.failed`) FROM Metric FACET dag
With this, you can now create a custom alert. For fast alerting, we recommend the following parameters:
Window duration - 30 seconds
Sliding window aggregation - Disabled
Slide by interval - Not set
Streaming method - Event timer
Timer - 5 seconds

Fill data gaps with - None
Evaluation delay - Not set

Thresholds: Critical: Query result is above or equals 1 at least once in 1 minute
Utilities
Here is an example of querying all failed metrics in NewRelic in the last 30 minutes, which might be useful for debugging connectivity issues/
SELECT *
FROM Metric
WHERE metricName = 'airflow.priority.p1.failed'
WHERE `airflow.priority.p1.failed` IS NOT NULL
SINCE 30 minutes ago UNTIL now