Datadog
Datadog integration will create Datadog metrics for DAG running, success, and failed status.
Setup
Create a new Datadog api key following their guide.
Configuration
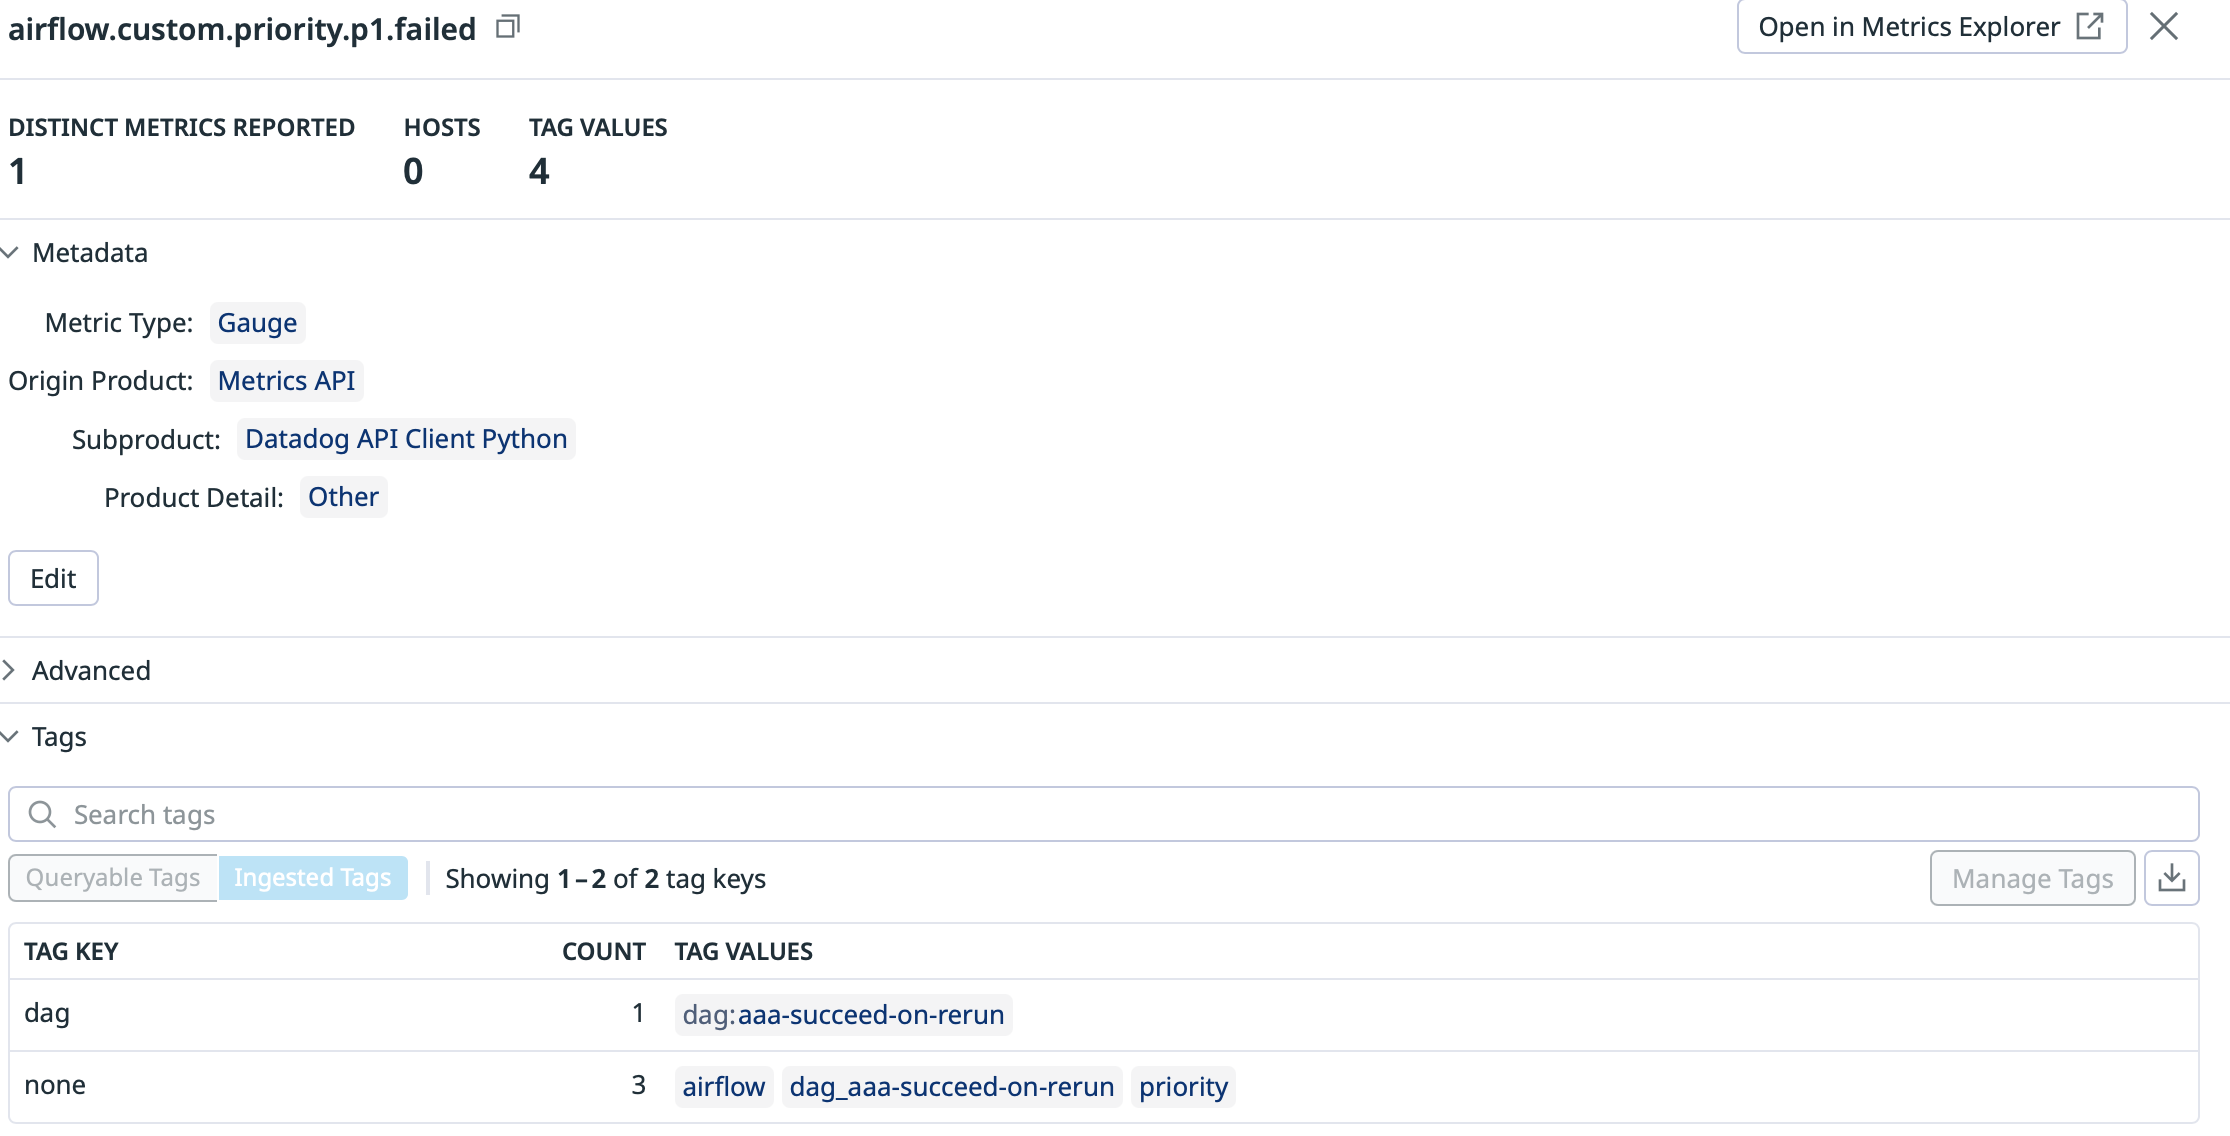
api_key: (Required) the API Key from abovehost: (Optional) Override the Datadog API host name. This is necessary for certain US and EU customers to use the Datadog API. The default ishttps://api.datadoghq.commetric: (Optional) Override the name of the metric. The default isairflow.priority, which will product metrics likeairflow.priority.p1.failedtags: (Optional) Optional extra tags to include, should be a comma separated list ofkey:valuestrings, e.g.tag1:val1,tag2:val2threshold: (Optional) Maximum alert threshold. Alerts with higher numerical priority (lower logical priority) will be ignored
Example
[priority.datadog]
api_key = the api key
host = https://us1.datadoghq.com
metric = my.custom.metric  # will produce metrics like my.custom.metric.p2.success
threshold = 2  # only P1 and P2
Monitor
Under Monitors, you can create a custom Datadog monitor to generate alerts when your DAGs fail.
To do so, follow the steps below. Note that some choices can be varied depending on your desired response time.
Create a
New Monitorand then chooseMetricUse the default
Threshold AlertChoose the correct metric source (the default would be something like
airflow.priority.p1.failed, but might vary if you customize the metric name)Select
from (everywhere), thenmin by dagEvaluate
sumover thelast 5 minutesSet
Alert Threshold > 0,Warning threshold > -1, which alert as soon as a DAG fails